Access Data
WeatherCitizen Map
The WeatherCitizen data map is a tool for visualizing, querying, and downloading data. The map is hosted at https://map.weathercitizen.org/.
This guide discusses the features and usage of the web map interface.
Interface
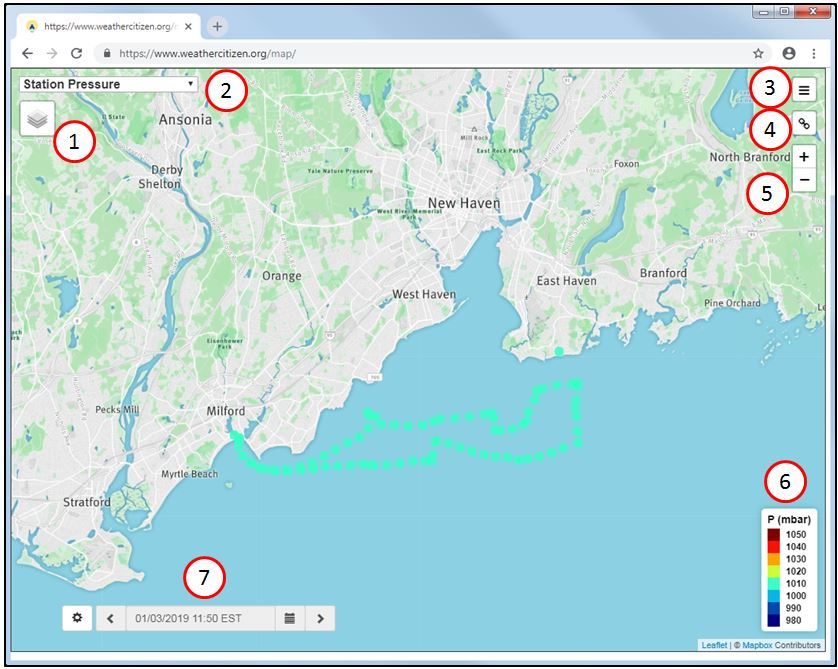
- Layer Selector - Changes the underlying map style (Aerial, Terrain, Contour, Streets).
- Data Selector - Changes the type of data being shown on the map.
- Settings Menu - Lets you change the map settings, including:
- Number of maps shown (you can have up to four maps showing simultaneously with different data types on each one)
- Data sources shown
- Time zone
- Units & Scale Extrema
- Filter by particular UUID (the anonymous ID for a particular user. You can find your own UUID in the settings page of the phone application).
- Link Generator - Creates a URL that you can copy into an email or document that will display the Webmap exactly as shown currently.
- Zoom
- Data Legend
- Time Window Picker - Select the time range you’d like to see data from. The time zone is set in the Settings menu. By default, the map shows data from the 24-hour period preceding the displayed time. Click the left or right arrows to move the time window backward/forward one day.
Detailed Time Selection
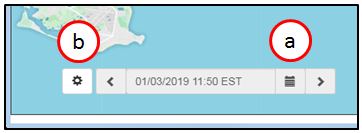
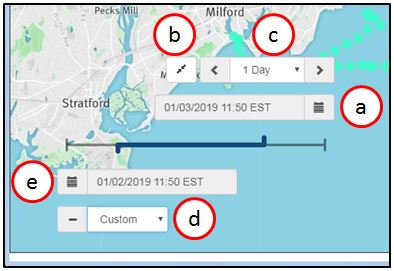
In the Time Window Picker, clicking on the calendar icon (a) opens up a calendar, allowing the user to jump to a specific time. Clicking on the gear icon (b) expands the Time Window Picker to allow for precise control of the time window:
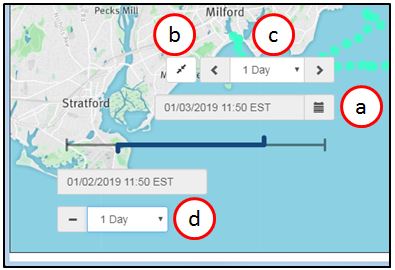
In the expanded picker, the user can also select:
- (c) The amount of time the window jumps forward or backward when the left or right arrows are clicked.
- (d) The length of the time window displayed on the map. If the user selects “custom,” the user has full control over the start time (e) and end time (a) of the time window:
Selecting Data
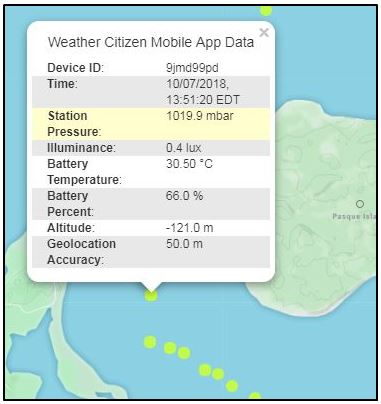
Left-clicking on any data point on the map will present a table with a subset of the data associated with the point, including the Device ID (uuid), the date and time the data point was gathered, and the highlights from the data stored in that data point.
Right-clicking on a data point exposes three extra options: Plot History, View Raw Data, and Export History.
Plot History
This shows a plot of the selected device and data type for a given period of time. Plots are generated using Vega visualization grammar.
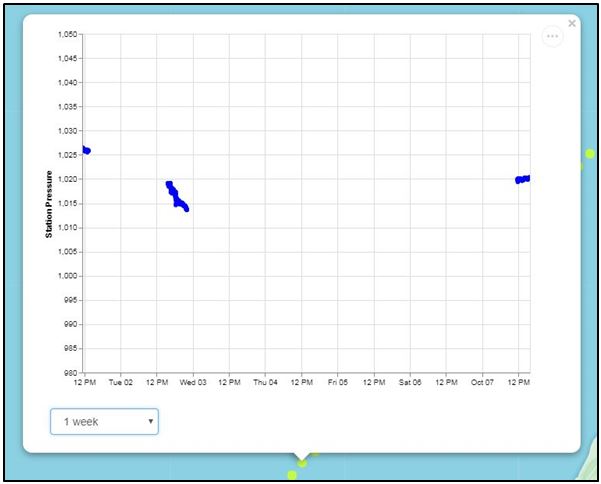
You can change the amount of time shown by using the drop-down menu in the bottom left of the pop-up. If you click on the ellipsis (“…”) button in the top right corner, you get options to save the plot or open it in Vega.
View Raw Data
This shows you all the data associated with the point, formatted as a JSON object.
Export History
This retrieves the entire data history of the device that recorded this data point, and exports it a JSON object array. Note this process may take awhile if the device has recorded lots of data.
API
Tutorial in development.
See the API Reference for the full reference to the WeatherCitizen API.
Python
Data can be accessed through Python two ways:
- weathercitizen.py: Simple helper library
- PODPAC: Python library for geospatial data analysis
weathercitizen.py
weathercitizen.py is a simple helper library to retrieve data from the API through Python.
Click the links below to download weathercitizen.py and a demo Jupyter Notebook:
- weathercitizen.py: Python library
- weathercitizen.py-demo.ipynb: Jupyter Notebook demo of
weathercitizen.py
weathercitizen.py requires requests and pandas to be installed in your active Python environment. To install, open a terminal window and run:
$ pip install requests
$ pip install pandas
Examples
# make sure `weathercitizen.py` is in the current working directory
import weathercitizen

# Get all data from the last hour
items = weathercitizen.get(collection="geosensors")

# Get all data from a time range
start_time = '2019-11-20 08:00:00' # UTC
end_time = '2019-12-10 08:00:00' # UTC
items = weathercitizen.get(collection="geosensors", start_time=start_time, end_time=end_time)

# Get all data from a single device
uuid = 're5wm615' # add device uuid here
start_time = '2019-12-13 08:00:00 -4' # UTC -4 (EST)
end_time = '2019-12-13 16:00:00 -4' # UTC -4 (EST)
items = weathercitizen.get(collection=["sensors", "geosensors"], uuid=uuid, start_time=start_time, end_time=end_time)

# Get data within a max distance from a center point
start_time = '2019-06-20 08:00:00 -4'
end_time = '2019-06-20 12:00:00 -4'
center_point = [-72.544655, 40.932559]
max_distance = 16000 # 1.6km radius
near = (center_point, max_distance)
items = weathercitizen.get(collection="geosensors",start_time=start_time, end_time=end_time, near=near)
PODPAC
PODPAC is a python library that builds on the scientific python ecosystem to enable simple, reproducible geospatial analyses that run locally or in the cloud.
PODPAC natively supports WeatherCitizen through the datalib.weathercitizen module.
See the full documentation at https://podpac.org
Examples
In development
MATLAB
In development
QGIS
Data served from the WeatherCitizen server is compatible with GIS software including the open-source QGIS software. We developed a QGIS plugin to allow users to efficiently query WeatherCitizen data. This guide provides an overview of how to download, install, and use the QGIS plugin.
Download and Install
- Download and install QGIS 3.x.
- Open QGIS and launch the Plugin Manager (Plugins -> Manage and Install Plugins…).
- Install and activate the QuickMapServices plugin.
- Open the QuickMapServices Settings (Web -> QuickMapServices -> Settings). Under More services click the Get contributed pack button. Verify that the Google Hybrid map is available from the QuickMapServices menu (Web -> QuickMapServices -> Google -> Google Hybrid).
- Download the WeatherCitizen plugin.
- Copy the
weathercitizenplugin folder into your QGIS plugins folder. For QGIS 3 on a Windows machine, this is typically inC:\Users\[YourUsername]\AppData\Roaming\QGIS\QGIS3\profiles\default\python\plugins - Launch the Plugin Manager again (Plugins -> Manage and Install Plugins…).
- Find the Weather Citizen plugin among the installed plugins and check the box next to it to activate.
The WeatherCitizen QGIS plug-in is now ready to use.
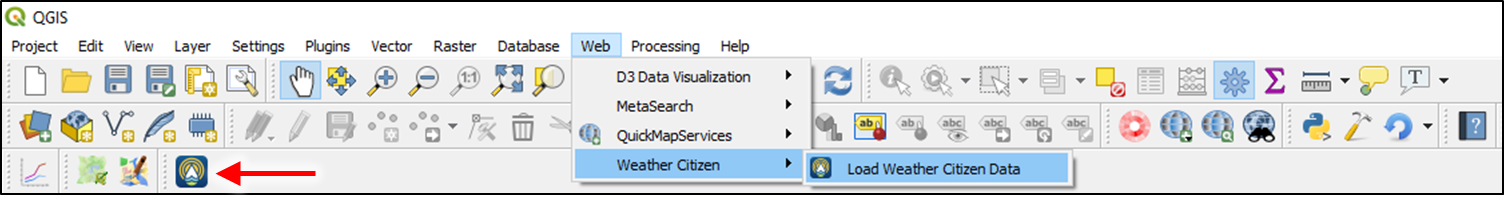
Using the Plugin
Once the WeatherCitizen plugin is installed and activated, it can be launched either through the Web drop-down menu or by clicking the logo on the Tool bar.
Launching the plugin loads the Google Hybrid map offered by QuickMapServices and opens the dialog box shown below.
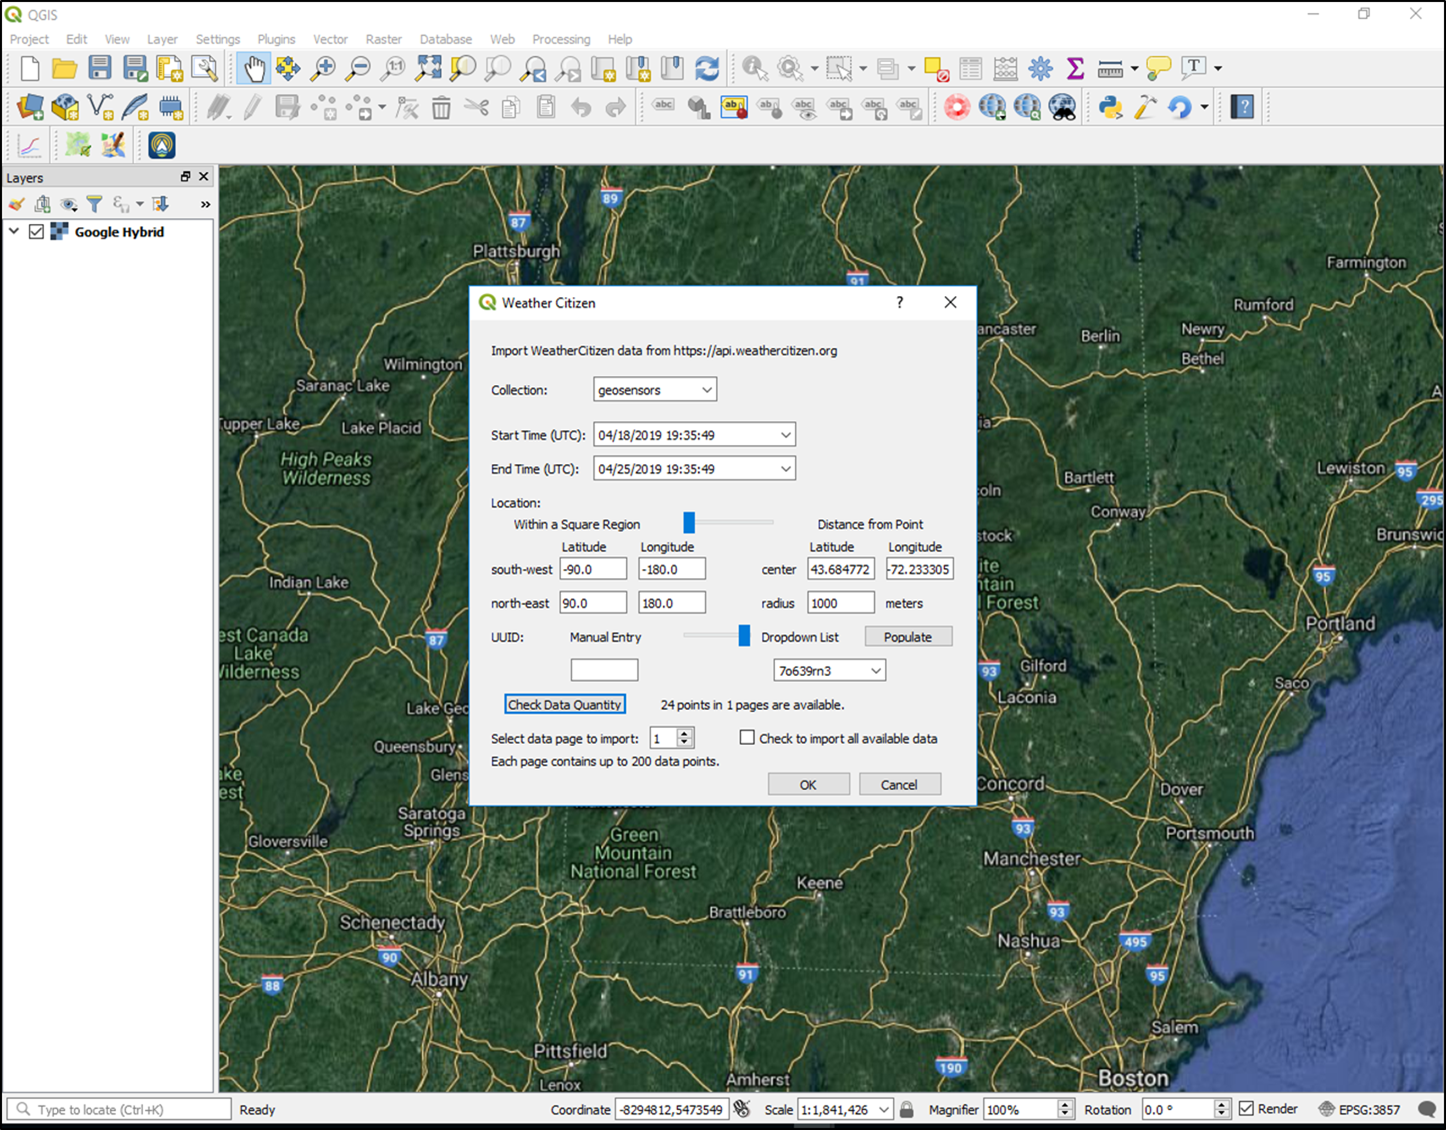
Selecting Data
Select the data collection (geosensors or NOAA buoys), time window, location, and uuid (for geosensors) of measurements to import. The location can be given as either a square region specified by latitude and longitude coordinates of the South-West and North-East corners (default coordinates give entire globe), or as a circular region specified by the center latitude and longitude and radius given in meters. For the geosensors collection, the 8 character uuid may be entered manually, or selected from a drop-down list. To populate the drop-down list with uuids with data in the selected time window and location, click the Populate button. To import data for all available uuids, select All from the drop-down menu, or leave the manual entry blank.
Data are organized for download in pages with 200 data points per page to avoid excessively large data requests and long download times. After selecting the collection, start and end times, and location bounds, click the Check Data Quantity button to see how many data points and pages are available that meet the criteria. Import either a single page, or all available data that meet the selection criteria using the check box Check to import all available data. The map scale and location will automatically adjust to zoom to the just-imported data.
Once geodevice data are imported to QGIS, a user can take advantage of QGIS features to calculate derived quantities combining several measured variables and visualize the results.